with Florent Mazel
As has been a recurrent topic on the blog recently (here, and here and elsewhere), it is difficult to know when it is appropriate and worthwhile to write responses to published papers. Further, a number of journals don't provide clear opportunities for responses even when they are warranted. And maybe, even when published, most responses won't make a difference anyways.
Marc Cadotte and I and our coauthors experienced this first hand when we felt a paper of ours had been misconstrued. We wanted to provide a useful, positive response, but whether the time investment was worthwhile was unclear. The journal then informed us they didn't publish responses. We tried instead to write a 'News and Views' piece for the journal, which it ultimately declined to publish. And really, a response piece is at cross-purposes from the usual role of N&V (positive editorials). In the end, rather than spend more time on this, we made the manuscript available as a preprint, found here.
The initial response was to a publication in Ecography from Miller et al. (2016) [citations below]. Their paper that does a nice job of asking how well 32 phylo-diversity metrics and nine null models discriminate between community assembly mechanisms. The authors first simulated communities under three main assembly rules, competitive exclusion, habitat filtering, and neutral assembly. They then tested which combination of metrics and null models yielded the best statistical performance. Surprisingly, only a fraction of phylo-diversity metrics and null models exhibited both high statistical power coupled with low Type I error rate. Miller et al. conclude that, for this reason, some metrics and null models proposed in the literature should be avoided when asking if filtering and competition play an important role in structuring communities. This is a useful extension for the eco-phylogenetic literature. However, the authors also argue that their results show that a framework for phylodiversity metrics introduced in a paper by myself and coauthors (Tucker et al. 2016) was subjective and should not be used.
What was disappointing is that there is a general issue (how can we best understand phylogenetic metrics for ecology?) that could benefit from further discussion in the literature.
Metrics can be analysed and understood in two ways: (1) by grouping them based on their underlying properties (e.g. by comparing mathematical formulations); and (2) by assessing context-dependent behaviour (e.g. by comparing metric performance in relation to particular questions). The first approach requires theoretical and cross-disciplinary studies to summarize the main dimensions along which phylo-diversity metrics vary, while the second provides a field-specific perspective to quantify the ability of a particular metric to test a particular hypothesis. These two approaches have different aims, and their results are not necessarily expected to be identical.
One reason there are so many metrics is that they have been pooled across community ecology, macroecology and conservation biology. The questions typically asked by conservationists and macroecologists, for example, differ from those of community ecologists. Different metrics frequently perform better or worse for different types of problems. The second approach to metrics provides a solution to this problem through explicitly simulating the processes of interest for a given research question (e.g. vicariance or diversification processes in macroecological research), and selecting the most appropriate metric for the task. The R package presented by Miller et al., as well as others (e.g. Pearse et al. 2015) all help facilitate this approach. And it can be very useful to a field when this is done thoroughly.
But this approach has some limitations as well - it is inefficient and sensitive to choices made in the simulation process. It also doesn't provide a framework or context in which to understand results. The general approach fills this need: the Tucker et al. paper took this approach and classified 70 phylo-diversity metrics along three broad mathematical dimensions: richness, divergence and regularity--the sum, mean and variance of phylogenetic distances among species of assemblages, respectively. This framework is analogous to a system for classifying functional diversity metrics (e.g. Villéger et al. 2008), allowing theoretical linkages between phylogenetic and functional approaches in ecology. We also carried out extensive simulations to corroborate the metric behaviour classification system across different assembly scenarios.
The minor point to me is that, although Miller et al. concluded this tripartite framework performed poorly, their results appear to provide independent support for the tripartite classification system. (And this is despite some methodological differences, including using a clustering algorithm instead of an ordination approach for metric grouping). The vast majority of metrics used by Miller et al. on their simulated communities group according to this richness-divergence-regularity classification system (see our Fig 2 vs. Miller et al.'s Fig 1B). And metrics like HAED and EED, which stem from a mathematical combination of richness and regularity dimensions, are expected to sometimes cluster with richness (as observed by Miller et al. but noted as evidence against our framework), and sometimes with regularity. There is specific discussion on this type of behaviour in Tucker et al., 2016.
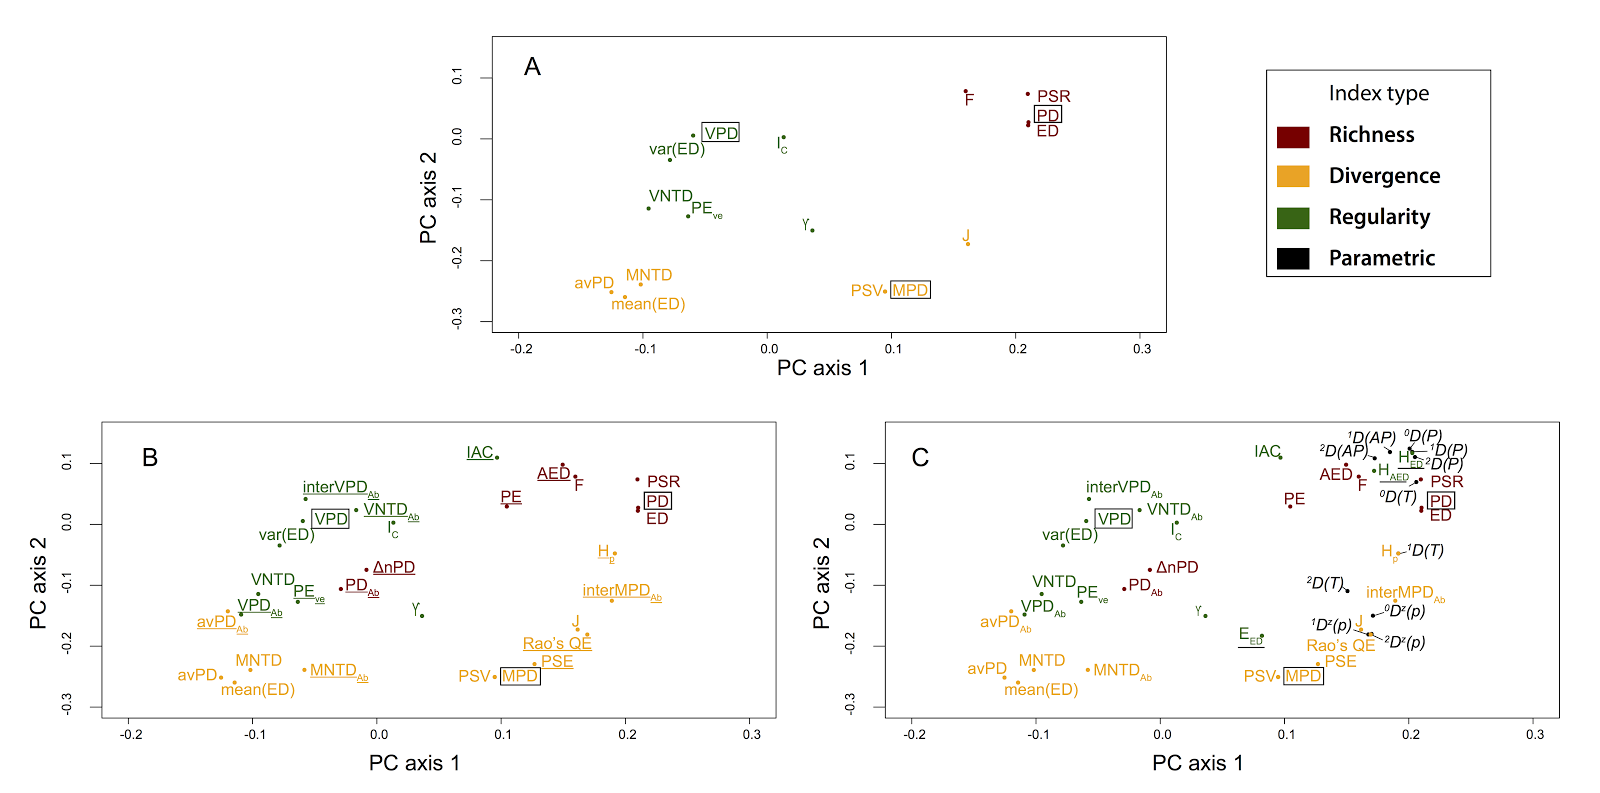 |
| Tucker et al. Fig. 2. "Principal
components analysis for Spearman’s correlations between the a-diversity metrics shown in
Table 1. Results represent measures taken from 800 simulated landscapes, based
on 100 simulated phylogenetic trees and eight landscape types defined in Table
2 (see Appendix S2) for detailed methods. (A) All metrics excluding abundance-weighted
metrics and those classified as parametric indices. (B) As in A, but with
abundance-weighted metrics included (underlined). (C) As in B, but with
parametric indices (black), and indices that incorporate multiple dimensions (underlined)
included (e.g. all a-diversity metrics). X and Y axes are scaled to reflect explained variance (PC1 = 41.8%; PC2 =
20.5% for the PCA performed with all metrics, shown in (C))." |
 |
| Miller et al. Fig 1B. "Dendrogram of intercorrelations among the phylogenetic community structure metrics, including species richness itself (labeled richness). Group 1 metrics focus on mean relatedness; Group 2 on nearest-relative measures of community relatedness; and Group 3 on total community diversity and are particularly closely correlated with species richness. Four metrics, PAE, EED , IAC, and EAED show variable behavior. They do not consistently cluster together or with each other, and we refer to their placement as unresolved. The branches of the dendrogram are colored according to the metric classifications proposed by Tucker et al. (2016): green are “regularity” metrics, pink are “richness” metrics, and yellow are “divergence” metrics." |
The major point is that dismissing general approaches can lead to more confusion about phylogenetic metrics, leading users to create even more metrics (please don't!), to conclude that particular metrics should be discarded, or to adopt hard-to-interpret metrics because some study found they were highly correlated with a response. Context is necessary.
I think both approaches have utility, and importantly, both approaches benefit each other. On one hand, detailed analyses of metric performance offer a valuable test of the broader classification system, using alternative simulations and codes. On the other hand, broad syntheses offer a conceptual framework within which results of more focussed analyses may be interpreted.
For example, comparing Miller et al.'s results with the tripartite framework provides some additional interesting insight. They found that metrics closely aligned with only a single dimension are not the best indicators of community assembly. In their results, sometimes the metrics with the best statistical performances are Rao’s quadratic entropy and IntraMPD. Because of the general framework, we know that these classified as are 'hybrid' metrics that include both richness and divergence in phylogenetic diversity. Taking it one step further, because the general framework connects with functional ecology metrics, we can compare their findings about Rao's QE/IntraMPD to results using corresponding dimensions in the functional trait literature. Interestingly, functional ecologists have found that community assembly processes can alter multiple dimensions of diversity (e.g. both richness and divergence)(Botta-Dukát and Czúcz 2016), which may provide insight to why a hybrid metric is useful for understanding community assembly.
In summary, there is both a forest and individual trees, and both of these are valid approaches. I hope that we can continue complement broad-scale syntheses with question- and hypothesis-specific studies, and that as a result the field can be clarified.
References:
Botta-Dukát, Z. and Czúcz, B. 2016. Testing the ability of functional diversity indices to detect trait convergence and divergence using individual-based simulation. - Methods Ecol. Evol. 7: 114–126.
Bryant, J. A. et al. 2008. Microbes on mountainsides: contrasting elevational patterns of bacterial and plant diversity. - Proc. Natl. Acad. Sci. U. S. A. 105: 11505–11.
Graham, C. H. and Fine, P. V. A. 2008. Phylogenetic beta diversity: linking ecological and evolutionary processes across space in time. - Ecol. Lett. 11: 1265–1277.
Hardy, O. 2008. Testing the spatial phylogenetic structure of local communities: statistical performances of different null models and test statistics on a locally neutral community. - J. Ecol. 96: 914–926.
Isaac, N. J. B. et al. 2007. Mammals on the EDGE: conservation priorities based on threat and phylogeny. - PLoS One 2: e296.
Kraft, N. J. B. et al. 2007. Trait evolution, community assembly, and the phylogenetic structure of ecological communities. - Am. Nat. 170: 271–283.
Pavoine, S. and Bonsall, M. B. 2011. Measuring biodiversity to explain community assembly: a unified approach. - Biol. Rev. 86: 792–812.
Pearse, W. D. et al. 2014. Metrics and Models of Community Phylogenetics. - In: Modern Phylogenetic Comparative Methods and Their Application in Evolutionary Biology. Springer Berlin Heidelberg, pp. 451–464.
Pearse, W. D. et al. 2015. pez : phylogenetics for the environmental sciences. - Bioinformatics 31: 2888–2890.
Tucker, C. M. et al. 2016. A guide to phylogenetic metrics for conservation, community ecology and macroecology. - Biol. Rev. Camb. Philos. Soc. doi: 10.1111/brv.12252.
Vellend, M. et al. 2010. Measuring phylogenetic biodiversity. - In: McGill, A. E. M. B. J. (ed), Biological diversity: frontiers in measurement and assessment. Oxford University Press, pp. 193–206.
Villéger, S. et al. 2008. New multidimensional functional diversity indices for a multifaceted framework in functional ecology. - Ecology 89: 2290–2301.
Webb, C. O. et al. 2002. Phylogenies and Community Ecology. - Annu. Rev. Ecol. Evol. Syst. 33: 475–505.
Winter, M. et al. 2013. Phylogenetic diversity and nature conservation: where are we? - Trends Ecol. Evol. 28: 199–204.