Monday, March 30, 2020

Early evidence that governmental responses to COVID-19 reduce urban air pollution

There is no doubt that the global spread of COVID-19 represents the defining crisis of the last decade. Governments around the world have scrambled to try to reduce person-to-person spread and deal with pressures on public health infrastructure. Regions with community spread have almost universally faced restrictions on travel, business and social activities. These restrictions are designed to reduce the exponential spread of COVID-19 (that is, to flatten the curve), these restrictions will also have a large number of other economic, social and environmental repercussions. Here, I ask a simple question: Has reductions in economic activity and movement caused by governmental responses to COVID-19 improved air quality in cities? I compare February 2019 and 2020 air quality measures and show that six cities that were impacted early by government restrictions in response to COVID-19 show consistent declines in five of six major air pollutants compared to cities that were impacted later (the text in this post has been modified from Cadotte 2020).


One of the most pernicious and inevitable consequences of urbanization and industrialization is the release of air pollutants. The WorldHealth Organization (WHO) estimates that about 90% of urban residents experience air pollution that exceeds WHO guidelines and that air pollution is responsible for more than four million premature deaths annually (World Health Organization 2018). Air quality is adversely affected by the aerosol release of a number of chemical compounds from agriculture, manufacturing, combustion engines and garbage incineration, and is usually assessed by measuring the atmospheric concentrations of six key pollutants: fine particulate matter (PM2.5), course particulate matter (PM10), ground-level ozone (O3), nitrogen dioxide (NO2), sulfur dioxide (SO2), and carbon monoxide (CO). These pollutants have a number of serious human health impacts (Table 1). Reducing inputs of these pollutants into urban areas requires a combination of technological advancement and behaviour change that can be stimulated by governmental regulations and incentives.


Table 1: The six commonly measured air pollutants in cities and their human health impacts.

Alterations of human, transport and industrial activity are usually the result of long-term economic and behavioural change and difficult to legislate under normal situations. However, the recent emergence of the global COVID-19 pandemic has had clear epidemiological impacts with, as of March 25, 2020, almost half a million confirmed infections and close to 20,000 deaths (World Health Organization 2020). This pandemic has resulted in emergency measures attempting to reduce transmission rates that limit activity, movement and commerce in jurisdictions around the world. While these emergency measures are critically important to limit the spread and impact of the coronavirus, they also provide a glimpse into how governmental calls for behavioural change can alter air pollution levels in cities.

Early evidence reveals that pollution levels have dropped in places that have undergone COVID-19 shutdowns. As Marshall Burke showed in a blog post,  PM2.5 and PM10, levels are lower than expected in parts of China. Here I examine January and February 2020 AQI levels for the six pollutants in Wuhan to what would be expected under normal circumstances. I further compare the change in February air pollution levels over the past two years in six cities that instituted emergency measures by the end of February (early impacted cities) to 11 cities that did not declare states of emergency until March (later impacted cities) using freely available air monitoring data (World Air Quality Index Project 2020) -see Table 2 for a list of cities.

Table 2: The eleven cities used in this analysis, the month that emergency measures were enacted and two- to six-year AQI averages of the pollutants
City-data come from monitoring agencies listed at the end of this post

Wuhan, China was the epicenter for the December 2019 emergence and the first person-to-person spread of the novel coronavirus.  In response, authorities initiated a series drastic measures limiting human movement and activity in Wuhan and large parts of Hubei province by the end of January. Three air pollutants: PM2.5, PM10 and NO2 all showed substantial January and February declines in Air Quality Index (AQI) (U.S.Environmental Protection Agency 2014) values over 2019 levels for those months and what would be expected from long-term trends (Fig. 1). These long-term declining air pollution trends do reveal that China’s recentpollution reduction and mitigation efforts are steadily paying off, but the government-enforced restrictions further reduced pollution levels. The expected air pollution values predicted by temporal trends (red dashed lines in Fig. 1) are all substantially higher than the observed levels, with observed values being between 13.85% lower than expected for January PM2.5 and 33.93% lower for January NO2. Further, the reductions in the pollutants shown in Fig. 1 increased the number of days where pollutant concentrations were categorized as ‘good’ (0 < AQI < 50) or ‘moderate’ (51 < AQI < 100) according to the AQI. The three other pollutants: SO2, O3 and CO, all showed idiosyncratic or non-significant changes, mostly because their levels have already reduced significantly over time or appear quite variable (Fig. 2). 

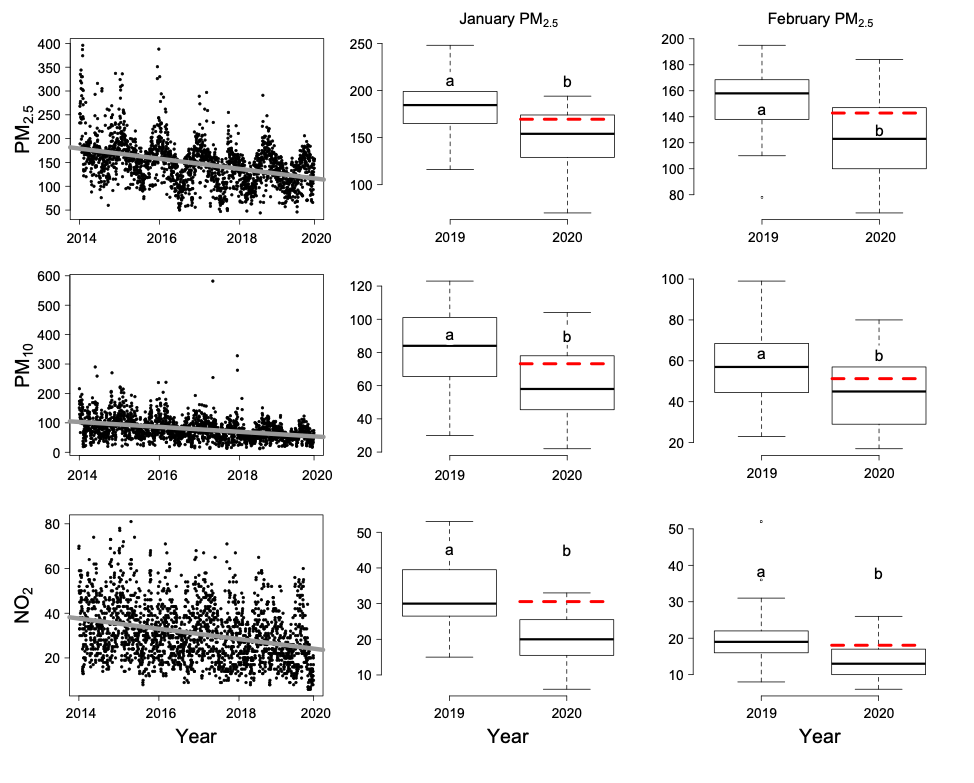
Fig. 1. Temporal patterns of Air Quality Index (AQI) PM2.5, PM10 and NO2 values in Wuhan, China. Both January and February, 2020 values show significant declines compared to 2019 levels and to that predicted from long-term trends (red dashed line).

Fig. 2. Temporal patterns of Air Quality Index (AQI) SO2, O3 and CO values in Wuhan, China.

Once COVID-19 moved to other jurisdictions, and confirmations of community spread emerged in February 2020, emergency measures, like those in Hubei province, were instituted to limit human movement and interaction. The cities subjected to February restrictions include, in addition to Wuhan, Hong Kong, Kyoto, Milan, Seoul and Shanghai, and the AQI values from these cities were compared to other cities that did not see the impacts of the novel coronavirus or have emergency restrictions in place until well into March. Log-response ratios between the air concentrations of pollutants observed in February 2020 to those from February 2019 reveal that all air pollutants except O3 show a decline in the 2020 values for the early impacted cities (Fig. 3). For later impacted cities, there is no overall trend in changes in the concentrations of pollutants between 2020 and 2019 and the individual cities in this group showed less consistency in the differences between years (Fig. 3). 

Fig. 3. Log response ratios for Air Quality Index (AQI) PM2.5, PM10, NO2, O3, SO2 and CO values between February 2019 and February 2020 values. Negative values indicate a decline in 2020. The green symbols indicate values from an assortment of cities that did not have emergency measures in place until March, 2020 (later impacted cities) and orange symbols are for cities that were impacted by the end of February.
These results indicate consistent air pollution reduction in cities impacted early by the spread of the novel coronavirus. However, the analyses presented here require further investigation as governments increasingly restrict activity world-wide, and some are discussing the possibility of prematurely lifting restrictions in order to spur economic growth. Further, the data analyzed here present point estimates of air quality but air pollution impacts are not homogeneous through urban landscapes and is influenced by spatial variation in industrial activities and transportation (Adams & Kanaroglou 2016). Thus, as higher resolution spatial air pollution data become available, it would be valuable to see how reduced activity affects air quality in different parts of cities.

This analysis of early data indicates that governmental policies that directly reduce human activity, commercial demand and transportation can effectively and quickly reduce urban air pollution. While the COVID-19 pandemic represents a serious risk for health and wellbeing of populations globally, especially those living in high density urban areas, the impacts of air pollution are equally consequential. If governments are willing to expend trillions of dollars in direct funding and indirect economic costs to combat this disease, then why do these same governments permit or even subsidize activities that emit air pollution? Maybe the lessons learned with COVID-19 can serve as the impetus for further action. Perhaps mandating changes to economic or transportation activity or investing in clean technology would better protect human health from the effects of air pollution.

Cited sources
Adams, M.D. & Kanaroglou, P.S. (2016) Mapping real-time air pollution health risk for environmental management: Combining mobile and stationary air pollution monitoring with neural network models. Journal of environmental management, 168, 133-141.
Cadotte, M. W. (2020) Early evidence that COVID-19 government policies reduce urban air pollution. Retrieved from eartharxiv.org/nhgj3
Cesaroni, G., Forastiere, F., Stafoggia, M., Andersen, Z.J., Badaloni, C., Beelen, R., Caracciolo, B., de Faire, U., Erbel, R. & Eriksen, K.T. (2014) Long term exposure to ambient air pollution and incidence of acute coronary events: prospective cohort study and meta-analysis in 11 European cohorts from the ESCAPE Project. Bmj, 348, f7412.
Fann, N., Lamson, A.D., Anenberg, S.C., Wesson, K., Risley, D. &Hubbell, B.J. (2012) Estimating the National Public Health Burden Associated with Exposure to Ambient PM2.5 and Ozone. Risk Analysis, 32, 81-95.
Greenberg, N., Carel, R.S., Derazne, E., Bibi, H., Shpriz, M., Tzur, D. & Portnov, B.A. (2016) Different effects of long-term exposures to SO2 and NO2 air pollutants on asthma severity in young adults. Journal of Toxicology and Environmental Health, Part A, 79, 342-351.
Kampa, M., & E. Castanas. (2008) Human health effects of air pollution. Environmental Pollution, 151, 362-367.
Khaniabadi, Y.O., Goudarzi, G., Daryanoosh, S.M., Borgini, A., Tittarelli, A. & De Marco, A. (2017) Exposure to PM 10, NO 2, and O 3 and impacts on human health. Environmental science and pollution research, 24, 2781-2789.
Raaschou-Nielsen, O., Andersen, Z.J., Beelen, R., Samoli, E., Stafoggia, M., Weinmayr, G., Hoffmann, B., Fischer, P., Nieuwenhuijsen, M.J. & Brunekreef, B. (2013) Air pollution and lung cancer incidence in 17 European cohorts: prospective analyses from the European Study of Cohorts for Air Pollution Effects (ESCAPE). The lancet oncology, 14, 813-822.
U.S. Environmental Protection Agency (2014) AQI: Air Quality Index. Office of Air Quality Planning and Standards, Research Triangle Park, NC.
World Air Quality Index Project (2020) https://waqi.info/.
World Health Organization (2018) Ambient (outdoor) air pollution: https://www.who.int/news-room/fact-sheets/detail/ambient-(outdoor)-air-quality-and-health.
World Health Organization (2020) Coronavirus disease 2019 (COVID-19), Situation Report –65.

City air quality monitoring agencies:
1 Division of Air Quality Data, Air Quality and Noise Management Bureau, Pollution Control Department, Thailand (http://aqmthai.com).
2 Delhi Pollution Control Committee (http://www.dpccairdata.com).
3 Hong Kong Environmental Protection Department (http://www.epd.gov.hk).
4BMKG | Badan Meteorologi, Klimatologi dan Geofisika (http://www.bmkg.go.id).
5South African Air Quality Information System - SAAQIS (http://saaqis.environment.gov.za).
6 Japan Atmospheric Environmental Regional Observation System (http://soramame.taiki.go.jp/).
7 UK-AIR, air quality information resource - Defra, UK (http://uk-air.defra.gov.uk).
8 South Coast Air Quality Management District (AQMD) (http://www.aqmd.gov/).
9 INECC - Instituto Nacional de Ecología y Cambio Climático (http://sinaica.inecc.gob.mx).
10 Agenzia Regionale per la Protezione dell'Ambiente della Lombardia (http://ita.arpalombardia.it).
11 CETESB - Companhia Ambiental do Estado de São Paulo (http://cetesb.sp.gov.br).
12 Department of Public Health of the Sarajevo Canton (http://mpz.ks.gov.ba/).
13 Air Korea Environment Corporation (http://www.airkorea.or.kr).
14 Shanghai Environment Monitoring Center (http://sthj.sh.gov.cn).
15 Israel Ministry of Environmental Protection (http://www.svivaaqm.net).
16 Air Quality Ontario - the Ontario Ministry of the Environment and Climate Change (http://www.airqualityontario.com/).
17 Wuhan Environmental Protection Bureau (http://www.whepb.gov.cn/).

Tuesday, March 24, 2020

The Fight for Bumblebees

*Guest post by Sonya Sharma, a student in Marc's 'Causes and Consequences of Diversity' class.


A rusty patched bumblebee (Getty Images)


Behind the scenes of the food we see stocked in grocery stores are arguably one of the most important organisms in the world, bumblebees (Bombus), which provide pollination in both natural and managed systems. However, human food security may be at risk because of the recent worldwide declines in bumblebee populations.

Land-use change is generally accepted as being the main driver of bumblebee abundance decline. Numerous studies have documented reductions in bumblebee populations more noticeably in areas that have gone through anthropogenic changes, such as agricultural intensification and urbanization. Bumblebee species richness seems to be positively correlated with the availability of grassland resources, such as pollen sources and nesting habitat, which are scarce in agricultural landscapes. Additionally, due to the mechanical disturbances across large areas that are characteristic of agricultural landscapes, they do not typically provide suitable habitat for wild bumblebee populations. Furthermore, bumblebees have a limited flight range, long colony cycle and specific food and nesting requirements that cause them to be especially susceptible to habitat loss.

Another factor that could be leading to the wild bumblebee decline is pathogen spillover from commercialized or domestic bumblebee populations. The commercialization of bumblebees as agricultural pollinators has inadvertently made wild populations more susceptible to a variety of emergent diseases and epidemics. Commercial rearing facilities provide an ideal environment for the development of a high load of pathogens and parasites because of the high density and high rates of transmission in these facilities. Constant pathogen spillover from commercialized bumble bees with high parasite loads could potentially extirpate small wild bumblebee populations. 
 
A bumblebee hive- similar to ones placed in agricultural landscapes (Wikipedia)

A further contributing factor to the decline in bumblebees is the use of pesticides. Specifically, neonicotinoid containing pesticides, which are most widely used globally, have been found to dramatically reduce egg-laying by queen bumblebees. To mitigate neonicotinoids detrimental effects, a new class of pesticides are being adopted worldwide, sulfoximines. However, a recent study suggests that sulfoximines may also diminish queen bumblebees’ reproductive capacity. Exposure to small amounts to a sulfoximine containing pesticide caused colonies to produce 54% fewer male drones and no new queen bees (Meeus et al., 2011). Therefore, pesticide use is very likely a contributing factor to the widespread bumblebee decline.

All factors considered; we can conclude that bumble bee populations are in serious risk of losing diversity and possibly going extinct. However, when it was proposed in June 2018 to include four species of bumblebee in the Californian Endangered Species Act, the state was sued by the Californian Farm Bureau Federation and six other agricultural associations. These groups argue that bees cannot be protected under this law because it defines candidate species as “bird, mammal, fish, amphibian, reptile or plant” and does not list any insects.

This conflict in government policy is not unique to California however, and is an example of the longstanding tension between conservation biologists and the agricultural industry about the protection of pollinators. If bumblebees were listed on the Californian Endangered Species Act it would restrict grazing, pesticides and the use of commercial bumblebees. It could also limit where bumblebee hives could be placed. Farmers and ranchers claim that listing bumble bees would harm agricultural production dramatically.

Other environmentalists suggest that attempts to conserve bumblebees should focus more on wildlife-friendly approaches such as increasing agricultural land set-asides, hedgerows and employing integrated pest management. Whatever the strategy taken through policy to protect bumblebees, it should aim to increase the abundance of grassland resources, reduce pathogen spillover from commercialized populations and reduce the use of harmful pesticides. How to create a policy that will appease both the agricultural industry and conservation biologists is still up for debate. However, all can agree that bumblebees are an indispensable member of both managed and natural ecosystems.

Works Cited:
Grixti, J. C., Wong, L. T., Cameron, S. A., & Favret, C. (2009). Decline of bumble bees (Bombus) in the North American Midwest. Biological Conservation, 142(1), 75–84.

Meeus, I., Brown, M. J. F., Graaf, D. C. D., & Smagghe, G. (2011). Effects of Invasive Parasites on Bumble Bee Declines. Conservation Biology, 25(4), 662–671.


Further reading:
Sulfoximine pesticide effects on bumble bees: https://www.the-scientist.com/news-opinion/New-Pesticide-Affects-Bumblebee-Reproduction-64647

California Cotton Growers petition: https://www.cottonfarming.com/special-report/seven-ag-groups-file-lawsuit-regarding-bumblebee-species/

Conservation Groups Join California in Legal Dispute Over Protecting Bumblebees: https://www.kqed.org/science/1956515/conservation-groups-join-california-in-legal-dispute-over-protecting-bumblebees

If Bumble Bees Become Endangered In California, Farmers Say It Sets A ‘Dangerous Precedent: http://www.capradio.org/articles/2020/02/05/if-bumble-bees-become-endangered-in-california-farmers-say-it-sets-a-dangerous-precedent/


Saturday, March 21, 2020

Why Honey bees aren’t the buzz


*Guest post by Shannon Underwood, a student in Marc's 'Causes and Consequences of Diversity' class.


When you think “Save the Bees”, most likely a Honeybee comes to mind – this is primarily because they have become the flagship species for the current bee crisis. Although responsible for bringing the much-needed attention to the impact humans are having on our bee populations, they greatly misdirect the public, making a large number of people significantly less aware of the other 4,000 diverse bee species we have in North America14 – our wild (native) bees: the ones we should be more concerned about.


Fig 1. Adapted from Wilson, Forister, and Carril 2017. Above figure shows the total amount of bee species survey-participants thought were in the United States.
Pollinators are responsible for supporting 35% of the global agricultural landscapes15. Outside of agriculture, 80-95% of the native flowering plants that are found in natural ecosystems rely on animal pollinators for reproduction11. Pollination is a fundamental ecosystem service provided by a variety of animals, however most efficiently by wild bees. The unique evolutionary histories that bees share with native plants has resulted in the vast diversity of traits seen among them (Photo 1), and communities with greater bee diversity have shown to be more productive than communities with poorer diversity12 - largely because of greater resource partitioning by the wild bees. Their foraging preferences, differences in body shapes and sizes, as well as some species ability to perform a more effective technique of pollination called buzz pollination, make wild bees the most important group of pollinators.


 Photo 1: Shows the different body shapes and sizes of some wild bees. This rich diversity reflects their unique coevolution with plants.

Bees are facing substantial reductions in their diversity, range and abundances worldwide1. In North America, there are currently 12 wild bee species that are recognized as ‘threatened’ under the IUCN Red-list. Staggeringly, all 12 of these species belong to the genus Bombus- commonly referred to as the Bumblebee. Over that last 20 years, Bumblebees have become one of the largest victims of decline in North America - with four species that faced a 23-87% shrinkage in their geographic range, and a precipitous 96% reduction in their abundance2. A leading cause of the declines in wild bee populations has been largely attributed to land-use change1. While the human population continues to expand, accumulating amounts of their natural habitat is lost and replaced with agricultural and urban landscapes. The fragmented habitats that remain often have decreased accessibility to green spaces and poorer nesting opportunities for bees. Making it harder for them to grab a foothold in the community – these human-added stressors put our wild bees at a much greater risk for extinction.


Fig 3. Adapted from Szabo et al. 2012. Shows the decline in the occurrence of B. affinis (A)B. terricola (B), B. pensylvanicus (C), and all bumblebee species (D) between the years of 1980-1990 (green) and 2000-2010 (blue).

The second most prominent impact on wild bee abundance and diversity has been greatly linked to invasive species like the common Western Honey bee1. The Honeybee, native to the Old World region, has become an invasive species in all areas outside of its origin3. Their uniquely large colonies and hive formation make them the most valuable pollinator to humans in agriculture management. Wild bee health and productivity is often reduced in agricultural landscapes because of the high use of pesticides and lower foraging opportunities7. To compensate for this, the honeybee has become a highly used technique worldwide because they can be easily transported to a field for crop pollination- many policies and conservation efforts tend to primarily focus on the protection of such managed bee species because of this. But the positive attention that the honeybee receives publicly leaves many people unaware that it is even invasive in North America.

Honeybees are generalists – a common characteristic for many invasive species8. They can forage up to 2-3km outside of their hive and will recruit other colony-workers once a good food source is found, in order to maximize their foraging products3. Because of their large numbers, they can greatly increase the foraging competition for our already-threatened wild bee species. Honeybees are also prone to several diseases and can increase the risk of transmission to our wild bee populations3. Although the honeybee is valuable in agricultural pollination for its cost and time efficiency, in many cases wild pollinators are better at pollinating than the honeybee alone (Fig. 4). The honeybee lacks the ability to perform buzz pollination - the amount of pollen a queen Bumblebee can deposit to a blueberry flower in a single visit would require a honeybee to visit the same flower 4 times9. These small and diverse organisms are thus extremely important for sustaining healthy natural ecosystems, and so it becomes increasingly significant that we find ways to support their abundance and diversity during this new human-dominated era.


Fig. 4. Adapted from Garibaldi et al. 2013. The figure shows that wild insects increased reproduction (y-axis) in all crops examined than the honeybee alone.

Cities are commonly viewed as human-dominated landscapes that are inhabitable for wildlife. However, some people argue that cities may actually be ecologically valuable to certain types of species like our insect-pollinators7. Cities often have less pesticide than the surrounding rural landscapes7, and the commonly used green infrastructures like green roofs, gardens, and parks can be extremely valuable to pollinators by offering more abundant and diverse foraging opportunities. Green infrastructure in cities is also recognized as being important for decreasing flight times and even providing habitat for certain species4. Many beekeepers highlight that one of the best things anyone can do to support wild bees is to transform their property into a bee sanctuary. Plant pollinator-friendly gardens and even incorporate bee hotels into your backyard as a way to offer wild bees more opportunities in developed areas. You can also take part in projects like “Bees In My Backyard”  and “Bumble Bee watch”  to help conservationists collect information on our current bee populations. More importantly, though, just becoming educated about the threats to our wild bees and spreading awareness to the people around you is a crucial step towards refocusing our pollinator conservation efforts, and bringing the attention away from the honeybee and rightfully onto our wild bees.


Literature cited

1.     Brown, Mark J. F., and Robert J. Paxton. 2009. “The Conservation of Bees: A Global Perspective.” Apidologie 40(3): 410–16.

2.     Cameron, Sydney A. et al. 2011. “Patterns of Widespread Decline in North American Bumble Bees.” Proceedings of the National Academy of Sciences 108(2): 662–67.

3.     Colla, Sheila R., and J. Scott MacIvor. 2017. “Questioning Public Perception, Conservation Policy, and Recovery Actions for Honeybees in North America.” Conservation Biology 31(5): 1202–4.

4.     Dylewski, Łukasz, Łukasz Maćkowiak, and Weronika Banaszak‐Cibicka. 2019. “Are All Urban Green Spaces a Favourable Habitat for Pollinator Communities? Bees, Butterflies and Hoverflies in Different Urban Green Areas.” Ecological Entomology 44(5): 678–89.

5.     Garibaldi, Lucas A. et al. 2013. “Wild Pollinators Enhance Fruit Set of Crops Regardless of Honey Bee Abundance.” Science 339(6127): 1608–11.

6.     Graham, Kelsey K. “Beyond Honey Bees: Wild Bees Are Also Key Pollinators, and Some Species Are Disappearing.” The Conversation. http://theconversation.com/beyond-honey-bees-wild-bees-are-also-key-pollinators-and-some-species-are-disappearing-89214 (February 20, 2020).

7.     Hall, Damon M. et al. 2017. “The city as a refuge for insect pollinators.” Conservation Biology 31(1): 24–29.

8.     “Invasive Species | U.S. Climate Resilience Toolkit.” https://toolkit.climate.gov/topics/ecosystem-vulnerability/invasive-species (February 21, 2020).

9.     Javorek, S. K., K. E. Mackenzie, and S. P. Vander Kloet. 2002. “Comparative Pollination Effectiveness Among Bees (Hymenoptera: Apoidea) on Lowbush Blueberry (Ericaceae: Vaccinium Angustifolium).” Annals of the Entomological Society of America 95(3): 345–51.

10.  Matias, Denise Margaret S. et al. 2017. “A Review of Ecosystem Service Benefits from Wild Bees across Social Contexts.” Ambio 46(4): 456–67.

11.  Ollerton J, Winfree R, Tarrant S: How many flowering plants are pollinated by animals? Oikos 2011, 120(3):321-326.

12.  Rogers, Shelley R., David R. Tarpy, and Hannah J. Burrack. 2014. “Bee Species Diversity Enhances Productivity and Stability in a Perennial Crop.” PLOS ONE 9(5): e97307.

13.  Szabo, Nora D. et al. 2012. “Do Pathogen Spillover, Pesticide Use, or Habitat Loss Explain Recent North American Bumblebee Declines?” Conservation Letters 5(3): 232–39.

14.  “The IUCN Red List of Threatened Species.” IUCN Red List of Threatened Species. https://www.iucnredlist.org/en (February 20, 2020).

15.  “What Are Pollinators and Why Do We Need Them? (Center for Pollinator Research).” Center for Pollinator Research (Penn State University). https://ento.psu.edu/pollinators/resources-and-outreach/what-are-pollinators-and-why-do-we-need-them (February 21, 2020).

16.  “Why bees matter.” Food and Agriculture Organization of the United Nations. 2018. http://www.fao.org/3/I9527EN/i9527en.PDF

17.  Wilson, Joseph S., Matthew L. Forister, and Olivia Messinger Carril. 2017. “Interest Exceeds Understanding in Public Support of Bee Conservation.” Frontiers in Ecology and the Environment 15(8): 460–66.


Thursday, March 12, 2020

The Homogenization of Urban Macro-systems

*This post is by Rabia Ahmed, a student in Marc's 'Causes and Consequences of Diversity' class.


If you have ever walked along a residential street in the city or suburbs you will notice many similar features in each backyard. Often times personal gardens are representative of peoples’ identities and reflect their membership in the neighbourhood. With the expansion of the urban population, an increasing area is covered by personal yards. While each homeowner views their yard to be small and therefore quite insignificant to the overall ecosystem- aggregated across the country, this area quickly adds up. 


 Despite the expansion of urban ecosystems little research has been devoted to understanding the patterns of ecosystem biodiversity, function and assembly. The findings of a recent paper by Pearse et al. (2018) investigated the extent to which “residential macro-systems” are the same across different US cities. The main focus of the paper was to compare the diversity, composition and structure of cultivated yards to the natural ecosystem in different climates across the US.

The results of the study showed that indeed the phylogenetic and species composition in yards had greater homogenization across regions compared to the corresponding natural ecosystems. There was also evidence of homogenization in vegetation as the tree density in yards remained similar across regions, despite the fact that, due to environmental filters, the tree densities in the different urban climates varied significantly. For example, the natural ecosystems in Salt Lake City and Los Angeles almost had no trees, but the tree density in the yards was well above zero.


Figure 1. The above diagram shows the convex hulls (dashed line) for three species pools: cultivated (orange), spontaneous (blue) and natural (green). The regions are abbreviated, Boston, Baltimore, Los Angeles, Miami, Minneapolis–St. Paul, Phoenix, and Salt Lake City as BOS, BA, LA, MI, MSP, PHX, and SL, respectively. The data shows that cultivated and spontaneous pools are more similar across regions than natural area pools, and in all cases, pools in the same geographical area are more similar than pools across a geographical region.
(Retrieved from Pearse et al. 2018)

Surprisingly, however, it was found that urban vegetation whether directly planted or spontaneously growing in the yards, had greater species richness than the comparative natural areas. The greatest phylogenetic diversity (MPD) was found within the fully cultivated yards, suggesting that these species would be better suited to future climate stressors due to their evolutionary distinctiveness. This variation in species lineages provides evidence that people prefer to have a variety of plants and flowers in their backyards which are not often found in the species pool.

Overall the data suggests that similarities in land cover and residential structural characteristics lead to a decrease in microclimate divergence at a continental scale.
These results underscore the common human preference for maintaining yards that are aesthetically pleasing and low maintenance. This homogenization has broad implications as it takes effort to keep these ecosystems the same, across forests, deserts and planes. For example, it has been observed that there is little difference between the amount of irrigation and fertilizers used by homeowners in the driest (Phoenix) or the wettest (Miami) cities.

While many argue that urban and suburban habitats do not compare to natural landscapes, recent research shows that they are more biologically diverse than previously assumed. The increased biodiversity is mostly because of the fact that people plant non-native species along with the native species, and artificial maintenance is used to overcome the environmental filter. Therefore, artificially enriched environments such as yards have both positive and negative consequences on the surrounding environment. For instance, researchers at Boston University found that trees in urban yards grow twice as fast as those in nearby forests, and store carbon at a faster rate. On the other hand, it was found that the rich mulched soils in suburban yards emitted twice as much CO2 as the soil in rural forests.

In conclusion, although yards have been given diminished importance in the study of human-dominated environments, they can provide great insight into how we can make our communities more sustainable. Residents, municipalities and neighbourhood associations can help reshape their residential macro-system into a thriving eco-system one backyard at a time. The key is to keep a balance between human preferences and other organisms’ needs, thus designing landscapes that are not only aesthetically pleasing but also support pollinators and birds.


References

Groffman, Peter M., et al. “Satisfaction, water and fertilizer use in the American residential macrosystem.” Environment Research Letters, vol.11, 29 Feb. 2016, doi:10.1088/1748-9326/11/3/034004
Humphries, Courtney. “The Residential Macrosystem.” Anthropocene, 21 June 2017, www.anthropocenemagazine.org/2017/06/residential-macrosystem-backyard-science/.
Pearse, William D., et al. “Homogenization of Plant Diversity, Composition, and Structure in North American Urban Yards.” Ecosphere, vol. 9, no. 2, 15 Feb. 2018, doi:10.1002/ecs2.2105.