Wednesday, April 22, 2009

People value rare species; at least from their computers

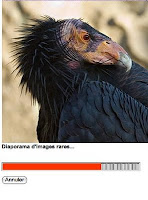
ResearchBlogging.orgDo people value rare species more than common ones? This is an important question for conservation because not only does valuation justify public funds being spent conserving rare species, but valuation can have negative implications as well. In what is called the ‘anthropogenic Allee effect’, increased valuation can increase species desirability –thus enhancing monetary value for exotic pets, building ecotourism lodges in sensitive habitats, or exotic tasty dishes (ah, The Freshman). In what is probably the most unique approach to assessing whether behavior is affected by the notion of species rarity, Angula and Courchamp, at the UniversitĂ© Paris Sud, used a web-based slideshow measure the amount of time people would wait to see a slideshow of rare versus common species.

Cleverly, they created a French website where visitors could select to view either a slideshow of common or rare species (and the links randomly changed positions on the site). The trick was that a download status bar appears and freezes near the end, and so Angula and Courchamp were able to measure how many visitors selected the rare species show and how long they waited until they gave up. Visitors were much more likely to select the rare species and to wait longer to see them.

I think that this study is extremely neat for two reasons. First it offers a novel way to quantify valuation, and second, it shows how the internet can be used to assess conservation issues in an efficient low-cost way.

Now will they please just show us the pictures of the cute, endangered species!

Angulo, E., & Courchamp, F. (2009). Rare Species Are Valued Big Time PLoS ONE, 4 (4) DOI: 10.1371/journal.pone.0005215

Friday, April 17, 2009

A mechanism on why communities of exotic species are less diverse than communities of native species

Plant communities dominated by exotics tend to be less diverse than plant communities dominated by natives. Apparently, few people have been curious enough to plan an experiment to try to further understand why this is the case. A recent paper in ecology letters Brian Wilsey and collaborators showed the results of an experiment designed to explore this. What they did is to create monocultures of a series of exotics and natives species, and mix cultures of exotics (a mix of 9 exotics, zero natives ) and mix cultures of natives (9 natives, zero exotics). They found that large exotics (plants with high aboveground biomass) tended to be even bigger when growing in mix cultures than in the monocultures, so big plants got bigger, which tend to reduce plant richness since it may displace other plants. On the other hand, for natives, small plants tended to get bigger, which is a mechanism for promoting biodiversity (communities may be more even). This research highlights the importance of understanding the mechanisms of plant coexistence and the fact that exotic species may behave very differently than native species.

Wilsey, B., Teaschner, T., Daneshgar, P., Isbell, F., & Polley, H. (2009). Biodiversity maintenance mechanisms differ between native and novel exotic-dominated communities Ecology Letters, 12 (5), 432-442 DOI: 10.1111/j.1461-0248.2009.01298.x

Sunday, April 5, 2009

Climate change increases West Nile Virus outbreaks in the U.S.

According to a study recently published in Environmental Health Perspectives, climate change has increased the prevalence of West Nile Virus infections in the United States. In one of the largest surveys of West Nile Virus cases to date, the authors find a correlation between increasing temperature and rainfall and outbreaks of the mosquito-borne disease between 2001 and 2005. Because warming weather patterns and increasing rainfall are both projected to accelerate with global warming, the authors predict that climate change will exacerbate West Nile Virus outbreaks in the future.

In the study, Dr. Jonathan Soverow and his collaborators matched more than 16,000 confirmed West Nile cases in 17 states to local meteorological data.

Warmer temperatures had the greatest effect on outbreaks. By extending the length of the mosquito breeding season and decreasing the amount of time it takes mosquitoes to reach their adult, biting stage, warmer weather means more biting mosquitoes longer. Moreover, increasing temperature speeds multiplication of the virus within insects, so mosquitoes in warmer climates have a greater viral load, making them more likely to infect humans.

Increased precipitation was also correlated with higher rates of West Nile Virus infection. A single, heavy rainstorm resulting in two or more inches of rain increased infection rates by 33%, while smaller storms had less of an effect on infection rates. Heavier rainfall events can increase disease prevalence by creating pools of water in which mosquitoes can breed and by increasing humidity, which stimulates mosquitoes to bite and breed. Total weekly rainfall had a smaller but significant effect on West Nile Virus infections, with an increase of 0.75 inch of rain/week increasing the number of infections by about 5%.

Warmer, wetter weather patterns might expand the niches of the mosquito species that carry West Nile Virus. In California, for instance, several mosquito species carrying the West Nile Virus have extended their ranges into higher elevations and coastal areas as temperatures have warmed. Changing weather patterns might also affect certain species of birds that are reservoirs for West Nile Virus. For example, droughts can push bird populations into urban areas, making West Nile Virus outbreaks in human populations more likely.

Soverow, J.E., G.A. Wellenius, D.N. Fisman, and M.A. Mittleman. 2009. Infectious disease in a warming world: How weather influenced West Nile Virus in the United States (2001-2005). Environmental Health Perspectives. Online 16 March 2009 DOI: 10.1289/ehp.0800487

Thursday, April 2, 2009

Letting out your little Monet

I realized, sometime not too long ago, that I really enjoy adding aesthetically pleasing details to my figures in scientific publications. All scientists look at hundreds of boring, monochromatic scatterplots, bar charts and ordination plots every month, so why not make them a little more appealing? If done right, the benefits are that people are more likely to remember your key figures and perhaps results, you can convey more information by incorporating imagery, and you may actually get a little joy out of preparing those figures. The downfalls are, if done poorly, they are distracting and publishing color figures is always costly for print editions.

Here are some examples of artistically augmented publication figures -but if you have other good examples, let me know and I'll add them:
This is from a recent Ecology Letters from Crutsinger, Cadotte (me) and Sanders (2009), 12: 285-292, trying to explain how we partitioned arthropod diversity into spatial components.


This one is from Ellwood et al. (2009) in Ecology Letters 12: 277-284, which shows co-occurrence null histograms for patterns of arthropods at various hight locations on trees.

This one is from Crutsinger et al (2006) Science 313: 966-968 that displays patterns at differing trophic levels by juxtaposing photos of specific tropic members.


Finally, the use of drawings and images to illustrate phylogenetic trends in phenotypic evolution is particularly useful. Above are two examples, on the left is from Carlson et al. 2009 Evolution 63: 767-778, showing patterns of darter evolution; and on the right is from Oakley and Cunningham 2002 PNAS 99: 1426-1430, showing evolutionary pathways of compound eyes.
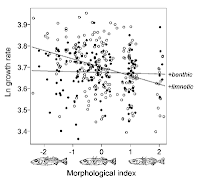

And here's one from Dolph Schluter (2000) American Naturalist 156: S4-S16, using drawings to illustrate how fish morphology corresponds to an abstracted index on the bottom axis.

Here are two from Joe Baily while working in Tom Whitham's Cottonwood Ecology Group that are effective ways to remind the reader what the treatments or dependent variables were (elk herbivory, leaf shape/genotype) and what the response variables were (bird predation, wood consumption by beavers). The left hand figure is from Baily & Whitham (2003) Oikos 101: 127-134 and the one on the right is from Baily et al. (2004) Ecology 85: 603-608.

Here is a great one posted by Ethan on Jabberwocky Ecology on Hurlbert's Unicorn!