Showing posts with label environment. Show all posts

Friday, May 6, 2016

What’s so great about Spain? Assessing UNESCO World Heritage inequality.

Some places are more valuable than others. We often regard places as being of high or unique value if they possess high biological diversity, ancient cultural artefacts and structures, or outstanding geological features. These valuable places deserve special recognition and protection. The sad reality is that when we are driven by immediate needs and desires, these special places are lost.

The natural world, and the wonderful diversity of plants and animals, is on the losing end of a long and undiminished conflict with human population growth, development, and resource extraction. We don’t notice it when there is ample natural space, but as nature becomes increasingly relegated to a few remaining places, we place a high value on them.

The same can be said for places with significant cultural value. Ancient temples, villages, and human achievement are too valuable to lose and we often only have a few remnants to connect us to the past.

In either case, natural or cultural, when they’re gone, we lose a part of us. That is because these special places tell us about ourselves; where we come from, how the world shaped us, and what unites all of humanity. Why did the world cry out in a united voice when the Taliban destroyed the Buddhas of Bamiyan in 2001, even though many of those concerned people were not Buddhist? The answer is simple –the expansion of Buddhism out of India along ancient trade routes tells us why many Asian nations share a common religion. They tell us about ourselves, the differences that interest us, and the similarities that bind us. The same can be said about the global outcry over the recent destruction of the ancient city of Palmyra by ISIS.

Before and after photos of the taller of the Buddhas of Bamiyan. Image posted by Carl Montgomery CC BY-SA 3.0.

Similarly, the natural world tells us about ourselves. The natural world has constantly shaped and influenced what it means to be human. Our desires, fears, and how we interact with the natural world are products of our evolution. If I flash a picture of a car to my 500-student ecology class, very few students, if any, screech in fear. But if I flash a photo of a hissing cobra or close-up of a spider, invariably a bunch of students squirm, gasp, or scream. Rationally, this is an odd response, since cars are the leading cause of death and injury in many western countries. Snakes and spiders kill very few people in Canada.

These special places deserve recognition and protection, and that is what the UNESCO World Heritage designation is meant to achieve. To get this designation for a site requires that countries nominate ones that represent unique and globally significant contributions to world heritage, and are adequately protected to ensure the long-term existence of these sites.  World Heritage sites are amazing places. They represent the gems of our global shared heritage. They need to be protected in perpetuity and should be accessible to all people. Though some I have visited seem like they are loved too much with high visitation rates degrading some elements of Heritage sites.

Examples of UNESCO World Heritage sites. A) The Great Wall of China. B) The Gaoligong Mountains, part of the Three Parallel Rivers of Yunnan. C) Angkor Wat in Cambodia. D) An example of a site that may be too loved -Lijiang in Yunnan. All photos by Shirley Lo-Cadotte and posted on our family travel blog -All The Pretty Places.

UNESCO World Heritage sites should also be representative. What I mean by this is that they should be designated regardless of national borders. Heritage sites are found on all continents across most countries –though a number of politically unstable countries (e.g., Liberia, Somalia, etc.) do not possess Heritage sites, likely because they lack the organization or resources to undertake the designation application process, and they lack the governance to ensure a site is adequately protected. But there are substantial differences in the number of World Heritage sites across nations[1]. Some countries, because of inherent priorities, national pride, resources or expertise, are better able to identify and persuade UNESCO that a particular place deserves designation.

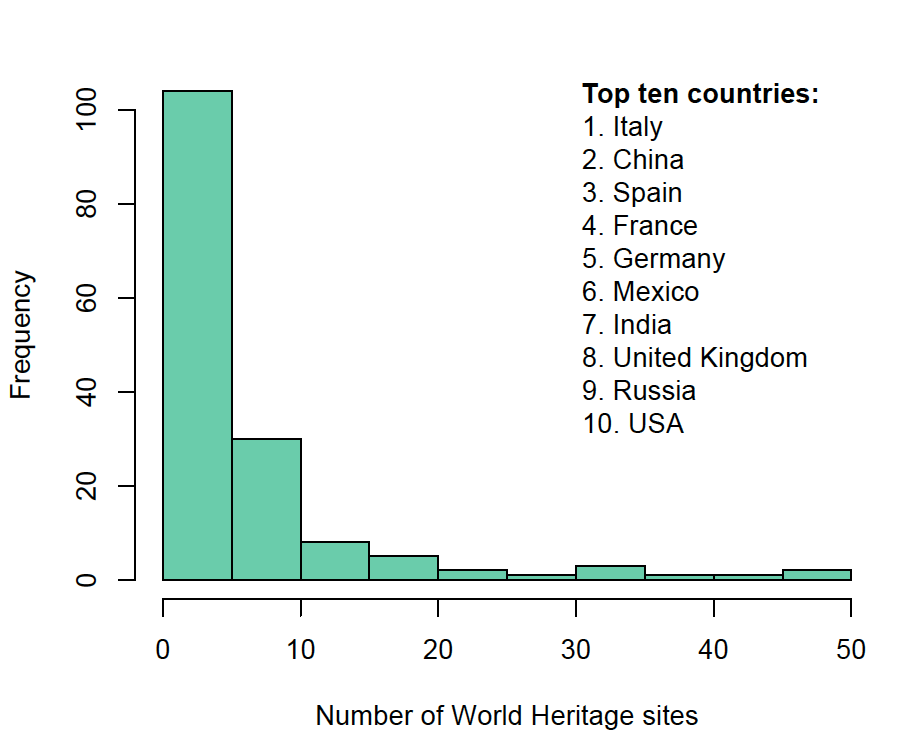
The distribution of the number of UNESCO World Heritage sites across countries and the top ten.

Why do we see such disparity in the number of World Heritage sites -where many countries have few sites, and a few countries have many sites? This is a difficult question to answer, and to do so I took an empirical approach. I combined data on the number of sites per country with Gross Domestic Product (GDP)[2], country size[3], and country population size[4]. I then ran simple statistical analyses to figure out what predicts the number of Heritage sites, and identified those countries that are greatly over-represented by Heritage sites, and those that are very under-represented. A couple things to note, the best statistical models included variables that were all log-transformed, I excluded the World Heritage sites that spanned more than one country, and I did not include countries that did not have any Heritage sites. The data and R code have been posted to Figshare and are freely available.

All three of GDP, area, and population size predicted the number of World Heritage sites. It is important to note that these three country measures are not strongly correlated with one another (only moderately so). So, larger, richer and more populous countries had more World Heritage sites. This makes sense –big countries should contain more unique sites due to random chance and more populous countries tend to have longer historical presence of organized states, and so should possess more cultural relics (especially China). GDP is more difficult to assign a reason, but high GDP countries should have robust national parks or other bureaucratic structures that assess and protect important sites, making them easier to document and justify for UNESCO.  GDP is quite interesting, because it is the single best measure for predicting the number of Heritage sites, better than population size and area. Further, neither country density (population/area) nor productivity (GDP/population) are strong predictors of the number of Heritage sites.

The relationships between the number of World Heritage sites and GDP, area, and population. Note that the axes are all log-transformed.

While these relationships make sense, it is also clear that countries are not all close to the main regression line and some countries are well above the line –meaning they have more Heritage sites than predicted; as well as some below the line and thus having fewer sites. When I combine the different measures in different combinations and look for the best single statistical explanation for the number of World Heritage sites, I find that the combination including GDP and population size, and their interaction (meaning that population size is more important for high GDP countries) is the best. For aficionados, this model explains about 65% of the variation in the number of Heritage sites.

Now, we can identify those countries that are over or under represented by UNESCO World Heritage sites according to how far above or below countries are from the predicted line (technically, looking at statistical residuals).

The deviation of countries from the predicted relationship between the number of sites and GDP and population (and their interaction). The top 5 over-represented and under-represented countries are highlighted.


The top five over-represented countries are all European, which means that given their GDP and population size, these countries have more World Heritage sites than expected. At the other extreme, countries under-represented come from more diverse regions including Africa, the Middle East and Southeast Asia.

An interesting comparison to think about is Germany and Indonesia. Germany has more World Heritage sites than expected (residual = +0.61) and is a moderately sized, high GDP country. Let me say, I like Germany, I’ve been there a half a dozen times, and it has beautiful landscapes and great culture. However, does it deserve so much more World Heritage recognition than Indonesia, which has fewer sites than expected (residual = -0.63)? Indonesia has spectacular landscapes and immense biodiversity and great cultural diversity and history. To put it in perspective, Germany has 35 World Heritage sites and Indonesia has just 8.

To answer the question in the title of this post: what’s so great about Spain? Well, it not only has beautiful and diverse natural landscapes and cultural history, but it appears to have the infrastructure in place to identify and protect these sites. It's place at the top of UNESCOs relative (to GDP and population) ranking of the number of World Heritage sites means that Spain's natural and cultural wonders are in good hands. However, for the countries at the other end of the spectrum, having relatively few World Heritage sites probably is not a reflection of these countries being uninteresting, or that they have little to offer the world, rather it is something more alarming. These places lack the financial capacity or national will to fully recognize those places that are of value to the whole world. The problem is that the globally important heritage that does exist in these places is at risk of being lost. These under-represented countries serve as a call to the whole world to help countries not just identify and protect heritage sites but to aid these countries with infrastructure and human well-being that empowers them to prioritize their natural and cultural heritage.

Wednesday, March 23, 2016

The evolutionary canary in the coal mine*

*note -this post originally appeared on the Applied Ecologist's blog

Like canaries in coal mines, species can provide important information about deteriorating environmental conditions. A whole sub-discipline of environmental biomonitoring has emerged to provide the necessary tools to evaluate biological responses to changes in environmental conditions. While historically biomonitoring focused on contaminant concentrations in sentinel species –such as heavy metals in clams; modern biomonitoring uses information across multiple biological levels of organisation, from tissues, to organism behaviour, to the abundances and distributions of species. Since it is impossible to assess every aspect of an ecosystem’s response to pollution, scientists and practitioners still need to make decisions about which elements of an ecosystem should be monitored.
A coal miner with a canary –the classic sentinel species (url for photo: http://www.academia.dk/Blog/wp-content/uploads/CanaryInACoalMine_2.jpg)

In freshwater systems, diatoms are often the preferred organisms for monitoring since they have high diversity and diatom communities are structured strongly by local environmental conditions. Because of their long use in biomonitoring, freshwater biologists have sensitivity and indicator values for thousands of diatom species. Thus, in principle, you should be able to sample diatom communities in lakes and rivers of interest, and then assess the water quality based on the presence and abundance of different diatom species. While such proxies should always be validated and interpreted carefully (Stephens et al. 2015), there is a long and successful history of using diatoms for environmental monitoring.
Image of diatoms from a scanning electron microscope. (By Kostas Tsobanoglou - Own work, CC BY-SA 4.0, https://commons.wikimedia.org/w/index.php?curid=45315566)
The difficulty in practice is to identify diatom species, which requires expert training and can be time consuming. A number of researchers have pursued proxies and surrogates, for example using life form (e.g., diatom shape) or higher taxonomic groupings, instead of identifying species (Wunsam, Cattaneo & Bourassa 2002). In a recent article in the Journal of Applied Ecology, Francois Keck and colleagues (Keck et al. 2016) take this one step further, by using diatom evolutionary relationships as the biomonitoring tool.

Keck et al. employ novel statistical methods to create clusters of species based on their evolutionary relatedness from a phylogenetic tree and species’ sensitivity to pollution and show that these clusters, when delineated by short to moderate phylogenetic distances, do a good job of replicating species-level community pollution sensitivity indices.

This may seem like a onerous task, to assign diatoms to a correct position on a phylogenetic tree, but with the availability and now widespread use of DNA barcoding techniques, it is becoming easier to get genetic data for microscopic assemblages than to identify cells to species. This means that samples can be fit to the phylogenetic clusters without needing to shift through samples. Further, if species are observed, which have not been properly assessed for their sensitivity, they can be assigned an expected sensitivity value based on their relatedness to assessed species.
The phylogenetic tree and species’ sensitivities (Fig. 2 in Keck et al.).
While diatom evolutionary history may not have been strongly influenced by environmental pollutants in the past –because they are relatively recent stressors; it is clear from Keck et al.’s results that closely related species are similarly sensitive to pollution. Other fields of applied management have also begun to incorporate evolutionary history in the design and assessment of applied actions –for example, restoration (Hipp et al. 2015). Evolutionary history can provide important insights and management tools for dealing with the consequences of environmental change.


References

Hipp, A.L., Larkin, D.J., Barak, R.S., Bowles, M.L., Cadotte, M.W., Jacobi, S.K., Lonsdorf, E., Scharenbroch, B.C., Williams, E. & Weiher, E. (2015) Phylogeny in the Service of Ecological Restoration. American Journal of Botany, 102, 647-648.
Keck, F., Bouchez, A., Franc, A. & Rimet, F. (2016) Linking phylogenetic similarity and pollution sensitivity to develop ecological assessment methods: a test with river diatoms (microalgae). Journal of Applied Ecology.
Stephens, P.A., Pettorelli, N., Barlow, J., Whittingham, M.J. & Cadotte, M.W. (2015) Management by proxy? The use of indices in applied ecology. Journal of Applied Ecology, 52, 1-6.
Wunsam, S., Cattaneo, A. & Bourassa, N. (2002) Comparing diatom species, genera and size in biomonitoring: a case study from streams in the Laurentians (Quebec, Canada). Freshwater Biology, 47, 325-340.


Saturday, February 6, 2016

Reining in traffic –looking to China for solutions?

Human impacts on landscapes are immense. Urban areas represent complete transformations of the geological, hydrological and ecological norms in landscapes. But while urban effects are concentrated to relatively small areas, the roads and rail lines feeding cities create a pervasive and diffuse network of negative impacts. Roads funnel rain runoff and can cause local flooding and this runoff also concentrates pollutants. Further, roads alter wildlife movement. For example, the fragmentation of formerly continuous forest in Florida is worsened by large busy roads, and black bears there are unable to move long distances to find mates. The result of this is that the Florida Black bear populations are getting smaller and more genetically inbreed.

Roads are created to meet traffic demands. The more people drive and the further they drive, the more roads we build. Cities around the world are growing, meaning that more cars are concentrated in small areas. The increase in automobile use also has direct environmental consequences. Cars, thanks to their internal combustion engines, add pollution to our local environments –carbon monoxide, particulate matter, and other toxins create smog, exacerbate respiratory ailments, and contribute to global warming.

More cars also means more traffic congestion and greater difficulty in getting from A to B, meaning that we spend more time travelling to, instead of being, somewhere. Heavy reliance on automobiles directly affects our quality life in both positive and negative ways.

1950s traffic jam in Los Angeles (from Wikipedia)
Given the undesirable consequences of cars, many cities try to reduce car use. In North America, cities employ a number of strategies, including: minor improvements to public transit (while often passing on the costs to riders), creating car free zones (which have been very modest in North America, whereas European cities have been much more successful –Montpellier, France is a great example), introducing tolls, and limiting parking in the city core. It is safe to say that the North American approach to dealing with traffic has been less than spectacular –just drive through Toronto or Los Angeles during rush hour.

Living in China for the past several months, I have been intrigued by how Chinese jurisdictions have dealt with traffic. And traffic was something that needed dealing with here. In the late 1990s and early 2000s, thousands of new cars were added to roads every single day.  The air quality in China is abysmal and having hundreds of millions of cars driving at the same time only make things worse. So governments in China decided to experiment with ways to reduce automobile use.

In China, much of the power to control automobiles resides with municipalities –they are the ones who set local traffic laws and issue license plates. From conversations with scientists from different regions of China, I have compiled ways different municipalities deal with traffic and reduce automobile use. Here are some of the ways that municipalities try to reduce automobile traffic:

1) Massive investments in public transit

There can be no real traffic solutions without building fast, efficient and affordable public transit. China has been a world leader in public infrastructure development over the past ten years. For example, Shanghai has one of the largest metro systems in the world, and has opened a new line every other year since 1999! They are currently building two new lines, which will give Shanghai 18 metro lines and about 400 stations. In Guangzhou, where I currently live, they also have a very modern and rapidly expanding metro system. Guangzhou currently has 8 lines with 4 more under construction! In all the Chinese cities I’ve been in, the metro systems are modern, efficient, heavily used, and very affordable. In Guangzhou, a bus ride works out to be about 35 cents US and a metro trip to the airport (the longest trip you can take in Guangzhou I believe) is about $1.15 US.

In Toronto, where I normally live, and like most other large North American cities, subway construction has not been sufficient to keep up with population growth. Local politicians seem to be unable to make the tough decisions to get public transit infrastructure built. But this infrastructure is the linchpin for any successful reduction in automobile usage.

2) Driving days

During the 2008 summer Olympics, Beijing created a system where cars were allowed on the roads only on certain days. Which days people could drive their cars depended on the last number of their license plates. This scheme was successful in reducing traffic congestion and air pollution. Since then, they have periodically reinstated this policy, especially during extremely bad air pollution days. I was there in early December, and road sharing was in effect then.

3) Making license plates really, really expensive (or difficult to get).

In Guangzhou, Beijing, and Shanghai, getting a car is easy, but getting a license plate, now there is the real hurdle. Since 2012, Guangzhou and other cities have severely limited the number of license plates issued, and now people can get a plate in one of two ways in these cities: by joining a lottery or going to an auction. In the lottery, a person submits an application and waits for the results. One person told me it took them three years to get their plate in the lottery. In the auction, the plates go to the highest bidder and the price for a license plate at auction has sky rocketed. A person told me that plates at auction now go for more than 60,000 RMB (about  $10,000 USD), which costs more than an economy car here! This person also quipped that the plates have become more of a status symbol than the actual car.

4) Your license plate will die

In Guangzhou and other cities, license plates expire. No, not like they expire in North America where you pay an annual license fee. They expire after 10 years and are no longer valid, and the driver must re-enter the lottery. 

5) Pay the toll

Many of the intercity highways have tolls here. While this is not a policy that affects travel behaviour within cities, it does influence driver choices traveling outside the city. Tolls only work when there are decent alternatives, and the rail system in China is excellent. There are frequent trains and many high speed lines in operation (where the trains go faster than 250 km/h). We don't have many toll roads in Ontario, but the one we have near Toronto, hwy 407, doesn't go into the city (so doesn't influence commuter decisions), and does not have viable options for alternative travel. This highway is an example of poor government policy and it was one of the worst policy decisions by a government who thought private companies should run public infrastructure. Its nothing more than a cash grab that doesn't serve the broader good. But I digress.

I have been struck by the variety of approaches and the experimental nature of policy making. What I mean by experimental, is that some policies seem to be ‘test run’ to see how people respond and if the policies result in the desired effects. China is able to institute creative and extreme measures because of the government’s unique ability to change policy without public debate. Often these policies are instituted overnight with little warning. In China, people seem to take government edicts with a “well, what can you do?” attitude. But if there is a country that can change the automobile culture, China is a good candidate. They did change what a family was with the one-child policy.

While most North Americans would certainly have a problem with the lack of transparency and seemingly impulsive nature of government decisions, China is providing the world with working examples of how to reduce the number of automobiles. It is clear to most, that without strong governmental leadership, a robust set of policies, and massive infrastructure investment, heavy automobile traffic will be unavoidable.


Friday, December 12, 2014

A changing world: Themes from the 2014 BES-SFE meeting in Lille #BESSfe


I attended the joint British Ecological Society/Société Française d’Ecologie (BES/SFE) meeting held in Lille, France, Dec. 9-12. I quite enjoy BES meetings, but this one felt just a little more dynamic and exciting. The meeting did a great job of bringing people together who otherwise might not attend the same meetings. The overall quality of talks was excellent and the impression was that labs were presenting their best, most exciting results. One thing that always fascinates me about meetings is the fact that emergent themes arise that reflect what people are currently excited about. Over the three days of talks, I felt that three emergent themes seemed particularly strong among the talks I attended:


1) Pollinators in a changing world

Photo by Marc Cadotte
There were a surprising number of talks focusing on human-caused changes to landscapes affect pollinator abundance and diversity. I am an Editor of a British Journal (Journal of Applied Ecology) and work on pollinator diversity has always been stronger in the UK, but there were just so many talks that it is obvious that this is an important issue for many people in the UK and Europe. Nick Isaac examined whether butterfly abundance was related to the abundance of host plants –which should be a measure of habitat quality. Plants that serves as hosts for caterpillars were more important than those that supply nectar to adults, presumably because the adults can better find resources. And specialist species were especially sensitive to host plant diversity.

Adriana De Palma gave a great talk on reanalyzing global patterns of bee responses to land-use and showed that biases in where research is done is influencing generalities. Bee communities in some well-studied regions appear more sensitive to land-use change and those regions with many bumblebees mask effects that on other types of bees. Bill Kunin examined patterns at a regional scale (UK) where a pollinator crisis was identified in the late 2000s and causes have been attributed to everything from land-use change to pesticide use to cell phones -to the second coming of Jesus. Habitat quality and flora resources do not seem to be that important at large scales, but there seems to be a strong effect of pesticide use. But at a smaller landscape scale, Florence Hecq showed that habitat heterogeneity within agricultural landscapes and the size of semi-natural grasslands were important for maintaining pollinator diversity. Changes in pollinator diversity have consequences for crop yield, as shown nicely by Colin Fontaine.
Photo by Marc Cadotte
 In a really interesting study, Olivia Norfolk showed that traditional agriculture practices by Bedouin minorities in Egypt enhanced pollinator abundance. Because their agricultural practices support high plant diversity, both wild and domestic plant species, pollinators fare better than in intense agriculture. Moreover, one of the most important crops, almonds, sees higher yield with higher plant diversity –though this effect is lost when there are a lot of introduced honeybees.


2) Effects of land-use on biodiversity

A number of other talks examined how human-caused changes influence biodiversity patterns and resulting functions across a number of taxa. Jonathan Tonkin examined a number of different types of species (plants, beetles, spiders, etc.) that occur along riparian habitats and showed that there weren’t concordant changes in richness, but there were simultaneous shifts in composition. Human stressed caused multiple communities to shift to very nonrandom community types. In Agricultural systems, Colette Bertrand showed that agriculture that changed frequently (e.g., crop rotation) supported more beetle species that systems where the same crops are planted year after year.

Human deforestation greatly changes many biodiversity patterns and we need to better understand these make sound conservation decisions. Cecile Albert examined land-use change and fragmentation in southern Quebec and showed that we can determine the importance of forest patches in human-dominated landscapes for the ability of species to move between large forested areas. Using her model she can identify where conservation and habitat protection should be focused. Nicolas Labriere studied how different forest changes influenced the delivery of ecosystem services, including carbon storage, diversity and soil retention. He showed that only intact forests were able to maximally deliver all ecosystem services.
 
From WWF

3) Species differences and dynamics at different scales

A major theme is how species differences are important for ecological processes, ecosystem function and conservation. I’ve argued elsewhere that we are heading into a paradigm shift in ecology, where we've moved from counting species to accounting for species. Wilfried Thuiller asked how well European reserves conserve different forms of biodiversity, namely functional and phylogenetic diversity. He prioritized species by their distinctiveness and range size so that the most important were functionally or phylogenetically unique and have a small range. Distinct mammals tend to not be well protected and the modern reserve system does not maximally protect biodiversity. This is most acute in eastern Europe where there is a order of magnitude less protected area than in western Europe.

Georges Kunstler argued that trait approaches to understanding competition are valuable because they can reduce the dimensionality of students, from all pairwise species interactions to relative simple measures of trait differences. He showed, using an impressive global forest dataset, that competition appears stronger when neighbour trees are more similar in their traits.

A number of talks examined if measures of species differences can explain biodiversity patterns. At very large scales, Kyle Dexter showed that phylogenetic diversity does not explain where species are across the neotropics. In some places species are in the same habitat as a close relative and sometimes with a distant relative. At smaller scales, talks explored trait or phylogenetic patterns Andros Gianuca, Anne Pilière and Lars Götzenberger all assessed the relative contributions of trait and phylogenetic differences to explain community patterns and all showed that phylogeny may be a stronger explanation than the traits they measured.


4) Species dynamics, coexistence and ecosystem function

Understanding tree growth and dispersal are key to predicting how forests will respond to environmental change and to successfully managing and conserving them. Sean MacMahon showed that the seasonality of tree growth is critical to modelling carbon flux in forests. He developed an ingenious set of modelling approaches to analyze daily tree diameter change and showed that growth is highly concentrated in the middle of the growing season, which is at odds with traditional conceptual models where tree growth is constant from spring to fall. Noelle Beckman examined tree dispersal and the consequence of losing vertebrate seed dispersers. She showed that reducing the number of seed dispersers results in low seeding survival because seedlings are locally very dense, instead of being dispersed, and seed predators and other enemies have an easier time finding them.

The mechanism most often cited by plant community ecologists is competition, but Christian Damgaard states that this simple mechanism is almost never tested. Further, models of competition are often based on numbers of individuals, but plants make such counts notoriously difficult. Instead he developed a very elegant model showing how plant height and horizontal cover feedback to competition. What he calls vertical density is a predictor of the following season’s horizontal cover. Competition is also key to observing a relationship between species richness and ecosystem function. Rudolf Rohr showed, using a series of Lotka-Volterra models that randomly assembling communities always results in a positive relationship between richness and function –which is why experiments often support this pattern. In natural communities, this relationship often disappears, and he shows that simulations with competitive sorting break this relationship.

Finally, Florian Altermatt examined whether the physical structure of stream networks influences the distribution of diversity in streams using protozoan and bacterial communities in series of connected tubes that look like a branch, and compared these to linear tubes. He found that diversity is highest in the interior branches (see image to the left), much like real rivers, and the linear system had no such pattern of diversity. He attributed part of this diversity gradient to competitive differences among species and differences in movement of the organisms.